Genetics Part I: DNA, Genes & Mendelian Inheritance
This is the first blog in a series on the field of imaging genetics.
A little bit about me: I moved to London in March 2020 to start a PhD under the supervision of Dr. Emma Robinson and Professor David Edwards at the Centre for the Developing Brain. The aim of my research is to understand how genetics influences brain development in babies, the ultimate goal of which is to improve the outcomes of babies who are at risk of poor neurodevelopmental outcomes. This means that I work alongside many different experts, all who approach this problem with their own perspective. This blog series is an attempt to bring these distinct fields, and their unique perspectives, into a single resource that is accessible and clear. Throughout this series, I hope to:
- Provide an overview of imaging genetics as a new scientific discipline
- Explain the relevant concepts of genetics and neuroimaging to those without prior knowledge
This blog is also a place to connect with others interested in neurodevelopment, medical imaging and genetics. There are so many ways to investigate early brain development, and we will do a far better job by working together. This series started life as a set of presentations to other members in the METRICS lab, who have strong expertise in mathematics, physics and computer science but less experience in biological sciences like genetics. If you feel that a concept isn’t clear, or has been overlooked, please do get it touch! Let’s begin.
What is imaging genetics?
Imaging genetics is a relatively new area of research that combines the fields of medical imaging and genetics to better understand neurological disease. More specifically, this field is focused on identifying how genetic changes manifest as changes on medical images like magnetic resonance images (MRI), and how these imaging changes relate to human traits and disease. When thinking about any medical disorder, it makes sense to look at the organ of interest. If we want to understand a neurological disorder, there is a reasonable chance we will get some insight by looking at brain structure and function using MRI. However, the rationale for incorporating genetics may be less clear.
Why genetics?
Every process that happens in the body is the result of genetics. It’s the human body’s version of an instruction manual, but far more sophisticated and complex. Genetics provide a step-by-step guide on how to build the basic building blocks of life (called proteins, a topic for a later blog), and how these building blocks work together to give rise to the structures and biological processes that make us human. Alterations to our genetics can lead to medical disorders, changes to the way the human body is structured and/or functions in a way that is harmful. Some medical disorders are due solely to genetic changes, although it is far more common for a disorder to be a result of both genetic and environmental factors. Therefore, understanding these genetic changes:
- Helps to explain the disease process;
- Allows us to identify high-risk patients; and
- Develop new treatments/tailor existing treatments to improve outcomes of patients with a disorder. The last point is particularly important as neurological disorders (especially those in early life) are some of the most challenging to treat.
Alongside the rationale for investigating the genetic contribution to neurological disorders, several factors have made it easier to incorporate genetics into neurological research:
- Acquiring genetic information from individuals is more financially viable. In 2001, the cost of replicating the full genetic code for a single individual totaled USD $100,000,000. To do the same thing in 2019 costs around USD $1000.
- Acquiring genetic information from individuals is relatively non-invasive and accessible. A saliva sample is enough to get the type of genetic information most commonly used in imaging genetics studies. This type of technology is also used by companies like 23&Me and Ancestry.com.
Having explored the motivation for investigating the relationship between genetics and neurological disorders, let’s explore some of the foundational concepts in genetics.
DNA
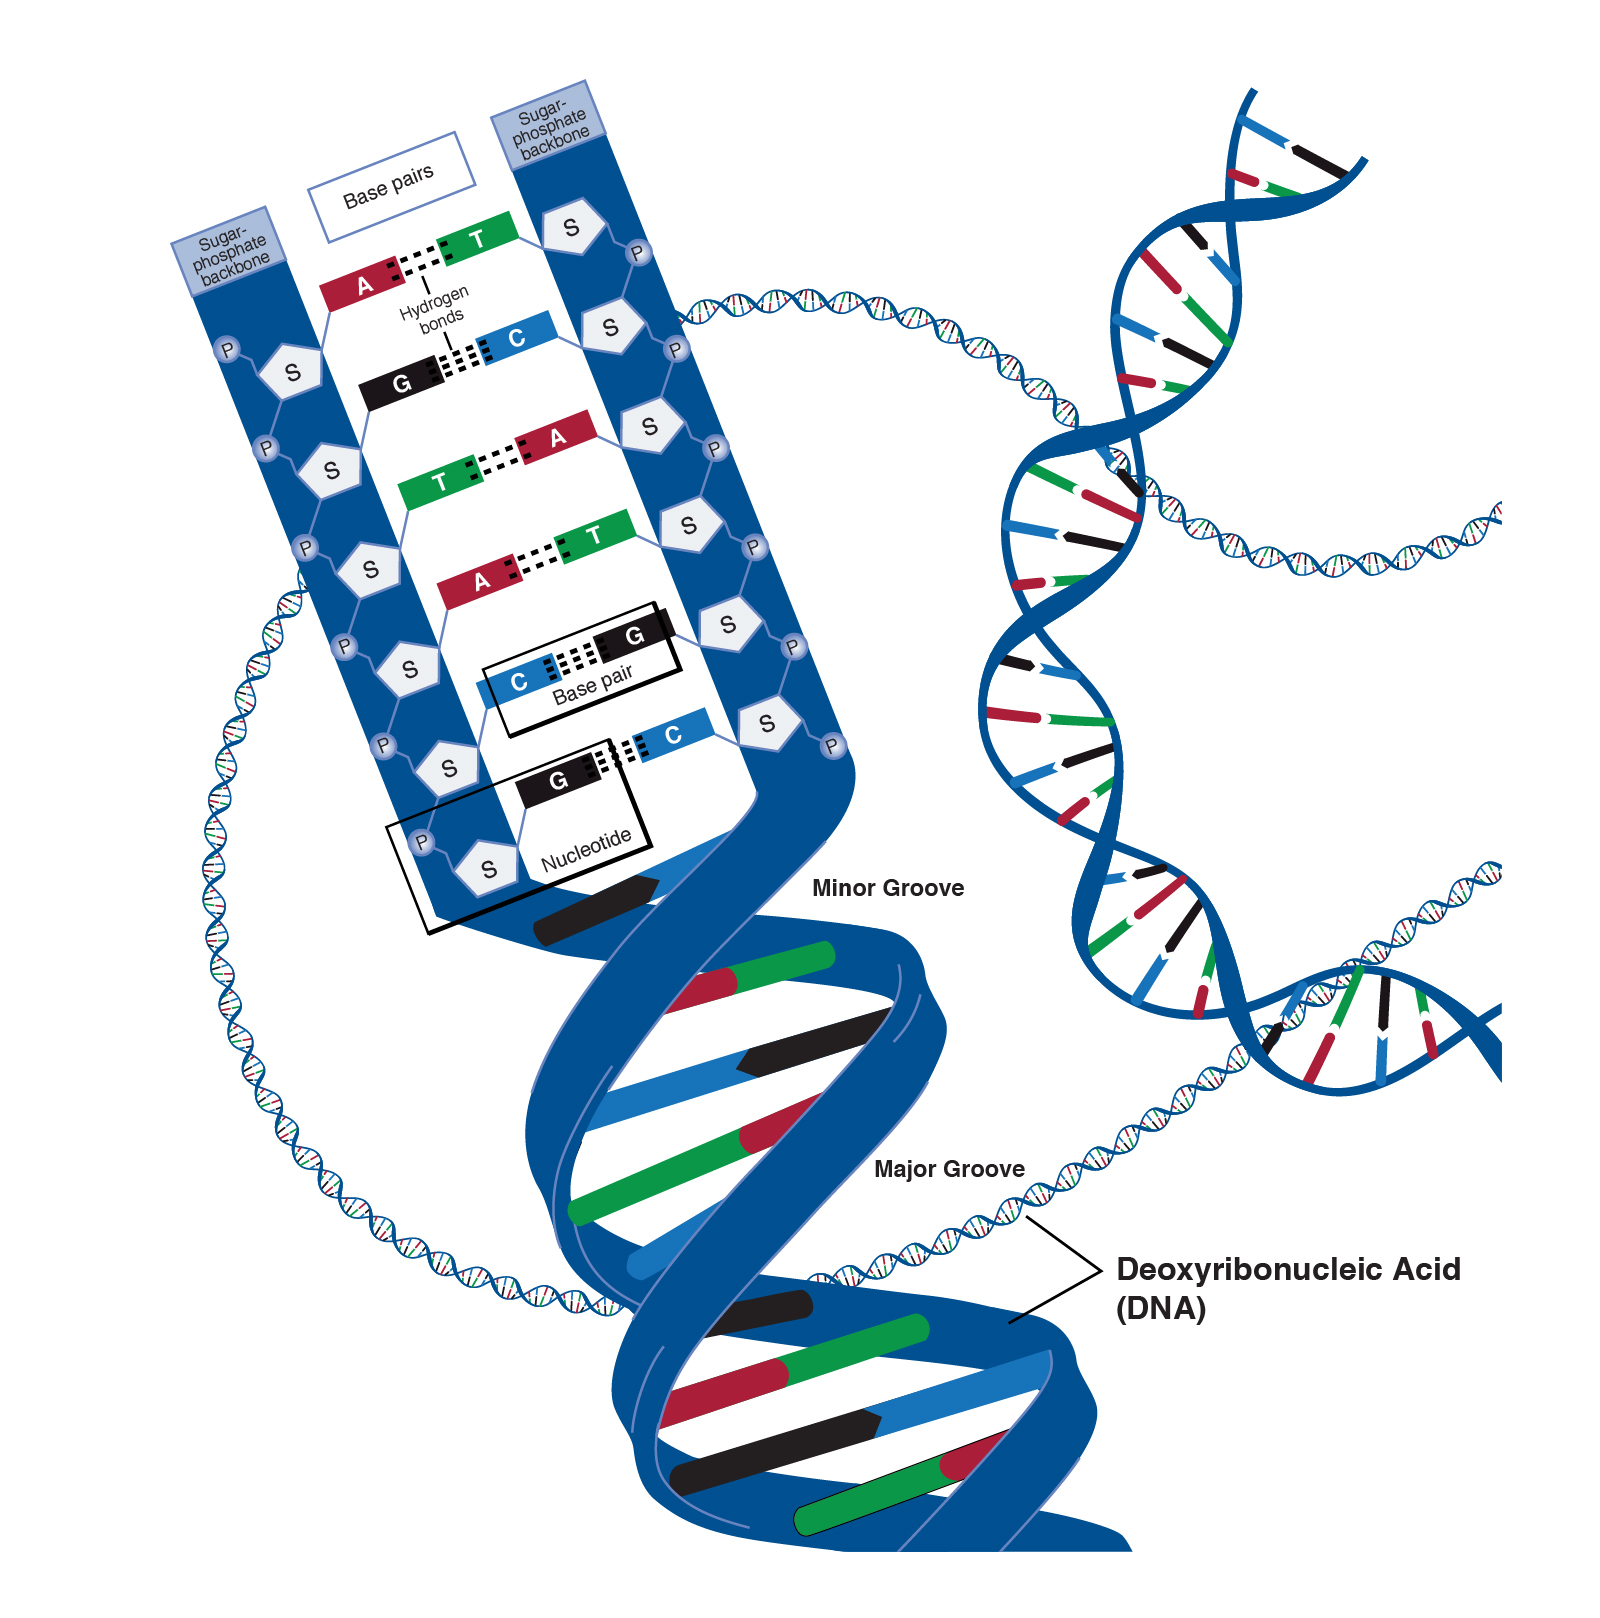
I’ve been using the term genetics to refer to the instructions responsible for coding the structure and function of the human body, and all its variation. To be more specific, this is the role of a molecule called deoxyribonucleic acid (DNA). DNA is structured like a ladder twisted around its long axis (figure 1), composed of two strands (imagine the side rails of the ladder). This structure is formally known as a double helix. Along the length of each strand is a sequence of chemicals called bases. In all living organisms, there are four different bases: adenine (A), thymine (T), guanosine (G) and cytosine (C). The rungs of the ladder are formed by a linkage between two bases, and there are specific rules that govern how these bases link together (pair): (A) can only pair with (G), and (T) can only pair with (C). This means that strands in a DNA molecule are not identical, but mirror images of one another (known as complementary).
 |
|---|
| Figure 1. Structure of DNA. Courtesy: National Human Genome Research Institute |
If humans all have DNA, how is there so much diversity in the human population? It is the ordering of the base pairs along DNA that encodes variation! It is helpful to draw an analogy between DNA and a book: the ordering of letters within a book is important for forming different words, and different combinations of words conveys different information. The amount of information encoded in human DNA is astounding: our full set of DNA (genome) is ~3,289,000,000 base pairs long!
Genes and Alleles
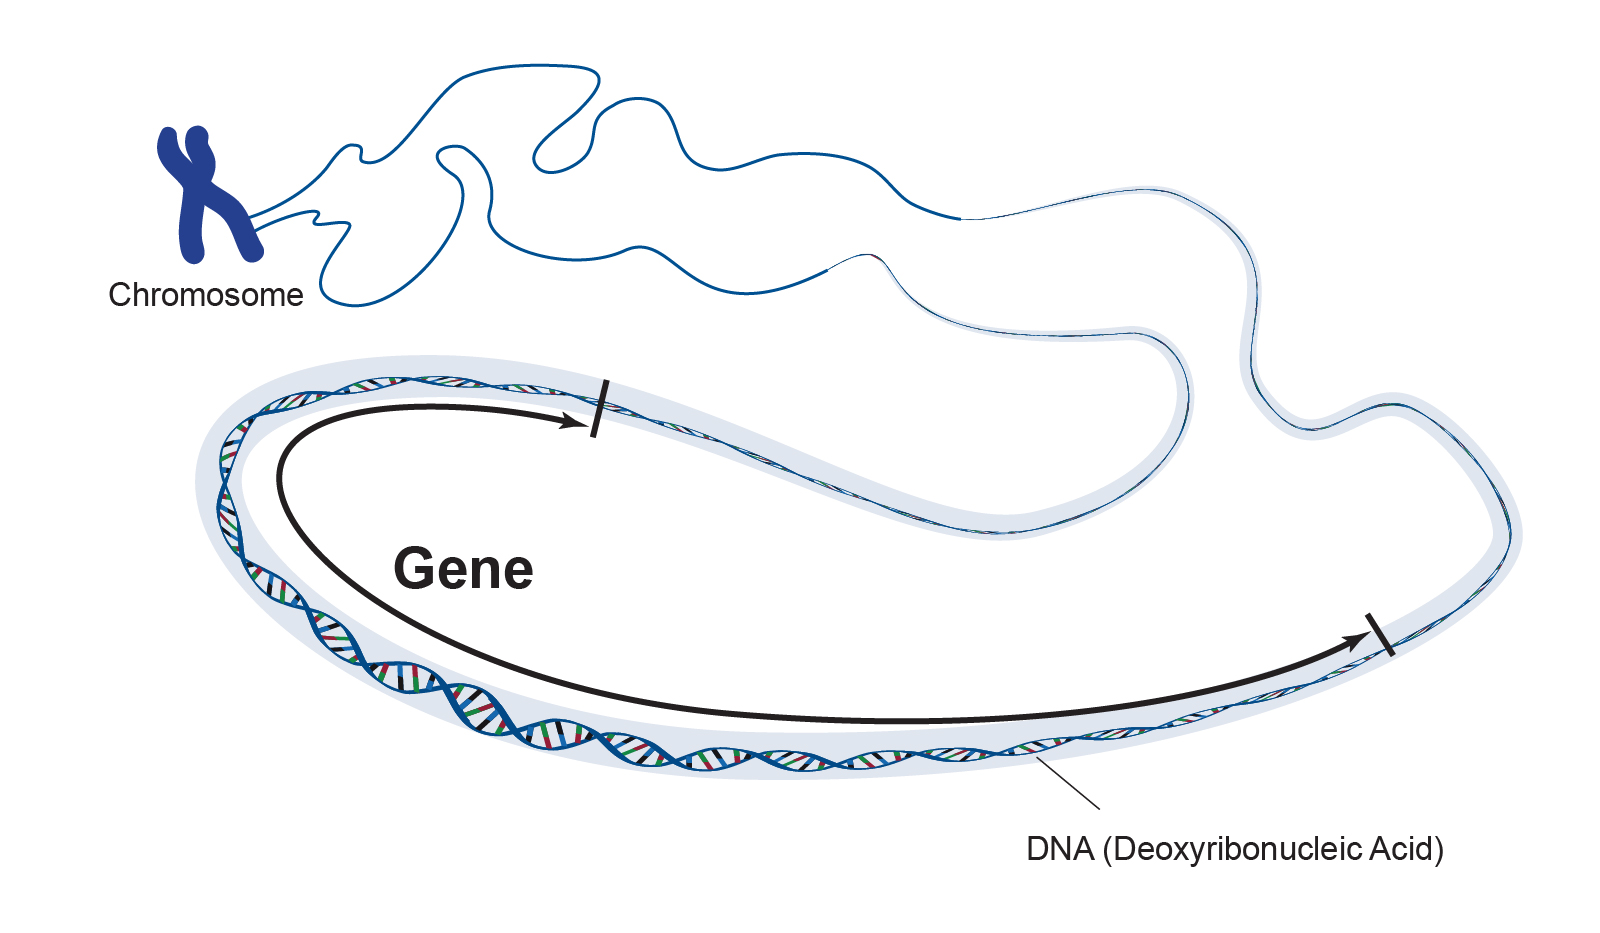
If DNA contains the full set of instructions encoding every characteristic (trait) in the human body, then a gene is the set of instructions encoding a specific trait like eye colour. To continue with our analogy, a gene is like a single paragraph, containing a small amount of information that helps tell the story in the book. Humans have between 20,000 – 25,000 genes, which are organized along the length of DNA (figure 2). There is a temptation to think that organisms with more genes are more complex, but the link between genes and traits isn’t straightforward (see genome size). It is also important to note that the term genome doesn’t refer to the total number of genes, which might be confusing (another topic for a later blog). Just as different genes encode different traits through variation in base pair sequence, variations in a single trait like eye colour are also due to differences in sequence. The gene encoding blue eye colour is largely identical to the gene encoding brown eye colour, only differing at specific points along the sequence. These different versions of a gene are known as alleles.
 |
|---|
| Figure 2. Representation of a gene. Courtesy: National Human Genome Research Institute |
Chromosomes
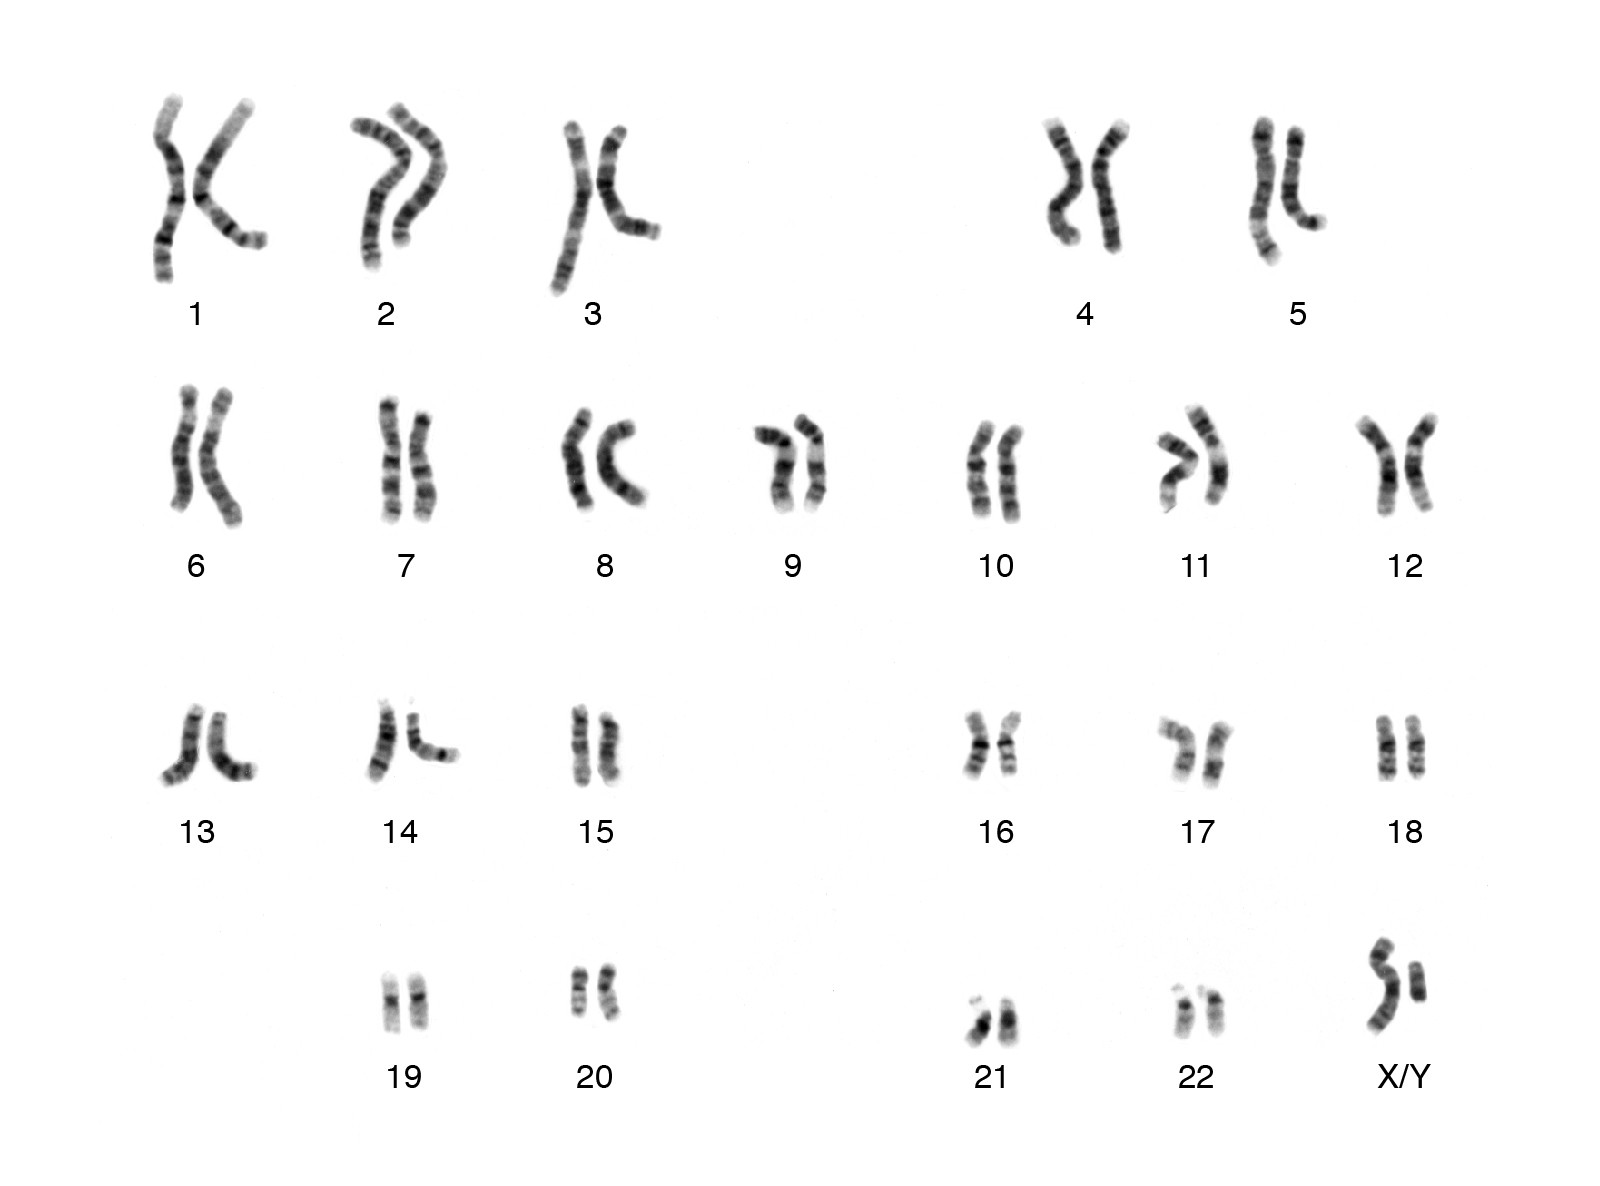
There are many levels of organization within the human genome. The entire 3,289,000,000 base pairs don’t exist as a single DNA molecule but as 46 distinct packages called chromosomes. In our analogy, chromosomes are like the chapters of the book. Together these 46 chromosomes form 23 pairs (figure 3). The 23rd pair are known as the sex chromosomes, which determine the sex of a person (distinct from gender). Females have two X chromosomes, and males have one X chromosome and one Y chromosome. Under a microscope, each pair of chromosomes have a unique banding pattern. These bands correspond (roughly) to genes organized along the length of each chromosome. The genes at each location are identical but aren’t necessarily the same version (allele). In other words, each pair of chromosomes contains the same genes at the same location. This means that we have two copies of every gene, not just one. The fact that we have two copies of every gene has important implications for reproduction
 |
|---|
| Figure 3. Example of a human karyotype. Courtesy: National Human Genome Research Institute |
Reproduction (strictly genetic)
Offspring are the product of both parents in that they receive genetic information from both parents. For offspring to have a total of 46 chromosomes, the genetic contribution from each parent needs to halve: instead of each parent contributing 46 chromosomes, they each contribute 23 to give a combined total of 46. This means that a parent contributes only one chromosome from each of the 23 pairs. When the genetic information from each parent combines, single chromosome from one parent pair with their corresponding chromosome from the other parent.
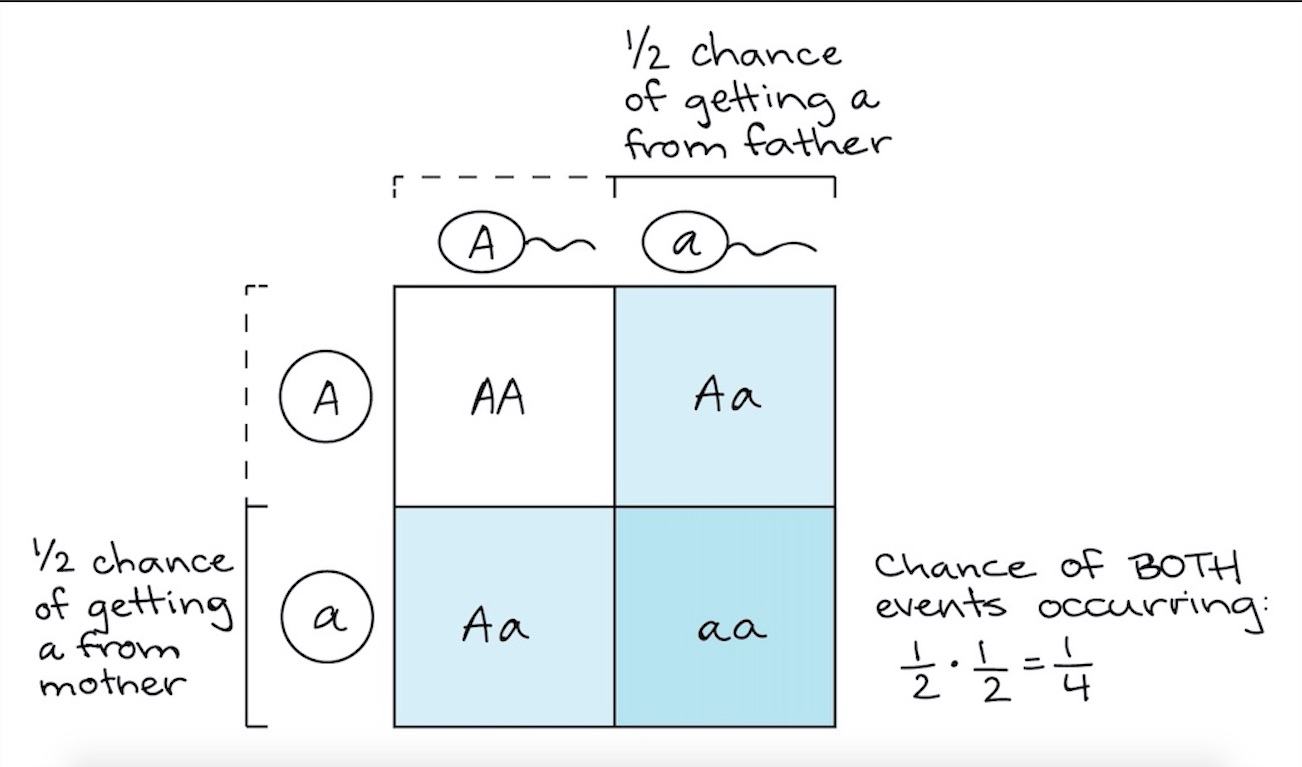
The chromosome that each parent contributes from a pair is random, and because each chromosome contains a particular allele, the resulting combination of alleles in the offspring is also random. We can view the possible outcomes of this process in a diagram known as a Punnett square (figure 4). In this example, we are considering the possible outcomes from two parents who each have two different alleles for the gene A. By convention different alleles are denoted by upper- and lower-case letters (for gene A, these are A and a).
 |
|---|
| Figure 4. Example of a punnett square. Courtesy: Khan Academy |
For each parent, the probability of either the A or a allele being passed down to their offspring is 0.5. This means that each of the combination of alleles has the following probability:
- AA = 0.5 x 0.5 = 0.25
- Aa = (0.5 x 0.5) + (0.5 x 0.5) = 0.5
- aa = 0.5 x 0.5 = 0.25
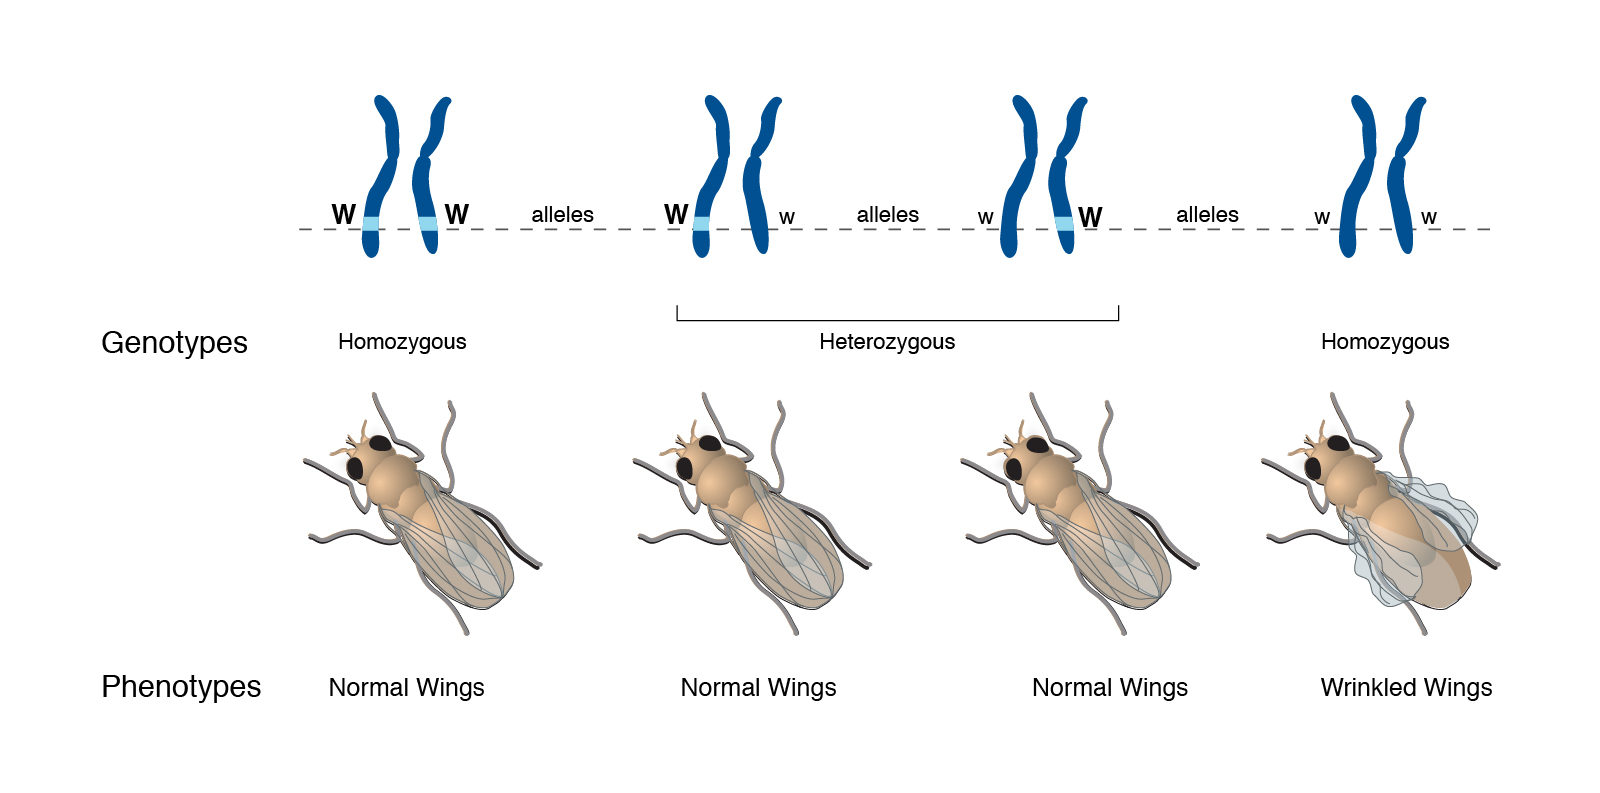
These different combinations of alleles are referred to as genotype. Offspring who have inherited two identical alleles (either AA or aa) are referred to as homozygous, and individuals to have inherited two different alleles (Aa) are referred to as heterozygous. The trait expressed as a result of a genotype is known as a phenotype. As mentioned above, the relationship between genes and traits (or genotype and phenotype) is not straightforward. Let’s go through a typical example (figure 5). In this example, we are looking at the gene W, which encodes wing shape in flies. The W gene has two alleles (W and w), and can form three different genotypes (WW, Ww and ww). From figure 5 we can see that flies with the genotypes WW and Ww have normal wings, and that flies with the genotype ww have wrinkled wings. We can simplify this inheritance pattern by recognizing that any fly who has inherited the W allele will have normal wings, and that a fly without a W allele (i.e. ww) will have wrinkled wings. The pattern of inheritance for the wrinkled wing phenotype is known as recessive – the trait will only be expressed in the absence of the W allele. Alternatively, the inheritance of the normal wing phenotype is known as dominant – the presence of the W allele masks the presence of the w allele.
 |
|---|
| Figure 5. Relationship between allele, genotype and phenotype in a fly for the W gene. Courtesy: National Human Genome Research Institute |
Mendelian Inheritance
This pattern of inheritance embodies one of the two laws that characterizes Mendelian inheritance, named after Johann Gregor Mendel (1822 – 1884). The inheritance pattern we have seen thus far is formalized in the Law of Segregation, which states that:
- Only one of the two gene copies present in a parent distributed to offspring
- The allocation of the gene copies to offspring is random
- The genotype of the offspring is the combination of alleles inherited from each parent
The other law that characterises Mendelian inheritance is the Law of Independent Assortment, which states that the alleles of two (or more) different genes get sorted independently of one another.
Although Mendel’s work was paramount to understanding genetics, many human traits and medical disorders cannot be modeled by Mendelian inheritance. However, there are some notable examples: Huntington disease is a neurodegenerative disease that is inherited in a dominant manner, and Sickle Cell Disease is a blood disorder that is inherited in a recessive manner.
Non-Mendelian Inheritance
More commonly, human traits and medical disorders follow non-Mendelian inheritance, which is an umbrella term for many different complex inheritance patterns:
- Pleiotropy: describes situations where a single gene can have roles many different biological processes and can therefore influence multiple traits
- Polygenic traits: describes traits that are the result of several genes acting together
- Incomplete Penetrance: a genotype has incomplete penetrance if a person with that genotype isn’t guaranteed to express the corresponding phenotype. For instance, some individuals with a disease-causing genotype will develop the disease (phenotype), while other won’t
- Variable expressivity: a phenotype has variable expressivity if the expression of the phenotype varies between individuals that have the same genotype. For instance, in a group of individuals with a disease-causing genotype, some might develop a severe form of the disorder, while others might have a milder form
Non-Mendelian inheritance poses significant challenges for scientists looking to pinpoint the genetic basis of many medical disorders. Later in the series, I hope to delve into some of the tools that we use to help decipher the complex relationship between genetics and disease. The next blog will cover how the information encoded in DNA is converted into a biological process.
Take-home points:
- Imaging genetics is a new field that aims to understand neurological disease by combining information from genetics and medical imaging like MRI
- The instructions for all biological processes are encoded in DNA
- Genes are segments of DNA that encode a specific biological process, which can influence either a single trait or multiple traits
- Many human traits and medical disorders follow non-Mendelian inheritance, a term used to describe the complex interplay between genes